RBA Cash Rate Graph
The RBA Cash Rate is set by the Reserve Bank of Australia, and their regular board decisions impact the retail rates made available from lenders. Movements in the cash rate impact the variable rate, although available fixed rates will be set based on trending cash movements. Read about the various rate borrowing options here.
The current cash rate is 4.10%.
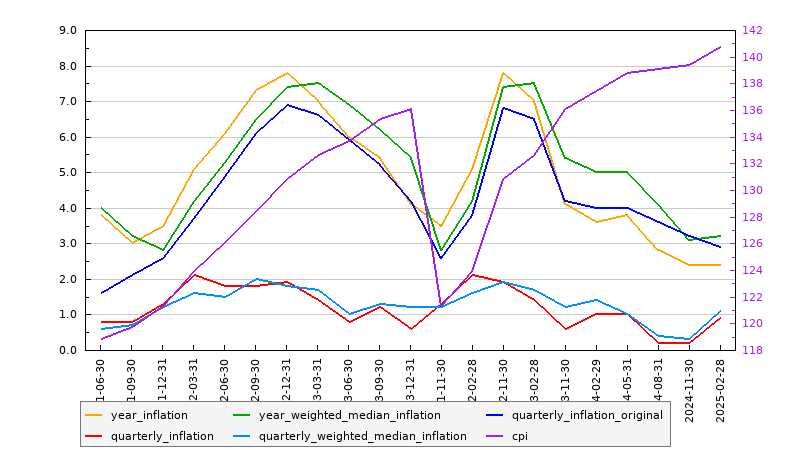
Inflation Graph [ Showing 4 Years of Data ]
Inflation is an increase in the level of prices of the goods and services that households buy. It is measured as the rate of change of those prices. Typically, prices rise over time, but prices can also fall (a situation called deflation). Read more here.

Monthly Currency Conversion [ DAILY ]
Review daily cash rate conversions here.
One Australian Dollar currency buys $0.67 USD.
Comparison Rate Graph [ Example ]
A comparison is the true cost of a loan every year, including fees and charges, and taking the product attributes into account. While an interest rate may be low to lure you into that product, the comparison rate provides a more realistic understanding of the cost of a loan, and allows you to more easily compare one loan against another. Read more here.
Comparison Graph: Above graph shows a comparison between published interest rates and the associated comparison rate.


